Mastering the Engulfing Candlestick Pattern: A Guide for Traders
Candlestick patterns are an essential tool for technical analysts and traders. When it comes to predicting whether market movements will reverse or continue, the engulfing candlestick pattern is among the most important and dependable options. Learning this pattern may provide you a significant advantage in trading, regardless of your level of expertise. The engulfing candlestick pattern is complex, so let's learn everything about it.
What Is the Engulfing Candlestick Pattern?
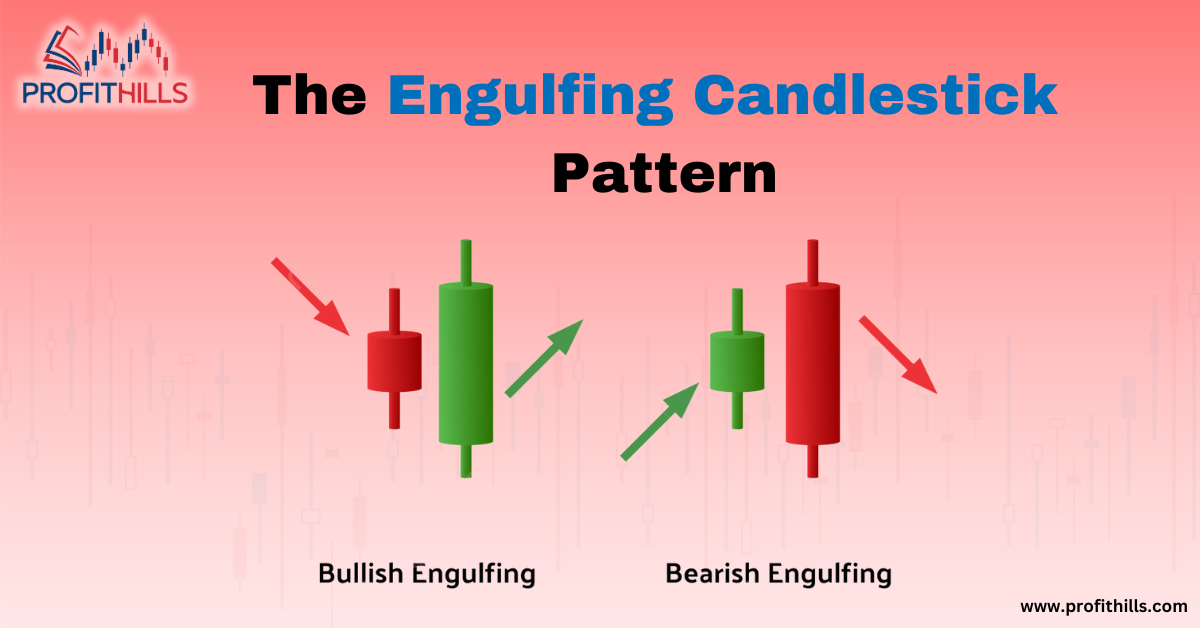
A two-candle reversal pattern known as an engulfing candlestick may emerge in markets that are either upwards or downwards. The characteristic feature of this design is the second candle entirely "engulfing" the first candle's body. When this happens, it usually means that market sentiment has changed significantly, which might mean that the current trend is about to reverse.
There are two categories into which the pattern falls:
- Bullish Engulfing Pattern: Points indicates the possibility of a trend change, maybe from down to up.
2. Bearish Engulfing Pattern: Points indicates the possibility of a downward trend reversal.
Traders should be aware that each kind has its own set of consequences that are conditionally and contextually specific.
Anatomy of the Engulfing Pattern
1. Bullish Engulfing Pattern
- Context: Seems during a downtrend.
- Structure:
- A bearish (usually red) initial candle indicates that the downward trend will likely continue.
- A bigger, bullish (usually green) second candle entirely engulfs the first candle's body.
· Interpretation: It seems that buyers are more powerful than sellers, which might turn the downward trend into an upward one.
2. Bearish Engulfing Pattern
- Context: Seems during an uptrend.
- Structure:
- Continued purchasing momentum is indicated by the first bullish candle, which is green in color.
o A bigger and more bearish second candle, engulfing the first candle entirely, is shown.
- Interpretation: It seems that sellers are more powerful than sellers, which might turn the uptrend trend into an downtrend one.
Why Does the Engulfing Pattern Work?
The engulfing pattern is effective because it signifies a dramatic change in investor sentiment:
· A huge bullish candle in a bullish engulfing pattern indicates a purchasing pressure surge that has surpassed the selling momentum that came before it.
· The big bearish candle in a bearish engulfing pattern indicates that sellers are in control and have pushed buyers to the sidelines.
When people's opinions suddenly shift, it usually draws in additional traders, which makes the trend reversal even more visible.
How to Identify the Engulfing Pattern
- Check the Trend:
- When prices are falling, you can see a bullish engulfing pattern.
- It has to happen during an upswing for the engulfing pattern to be bearish.
o The bodies of the two candles must totally envelop each other. We will not be focusing on wicks or shadows.
- Volume Confirmation:
o The consistency of the pattern is enhanced by increased trading activity during the second candle.
- Context is Key:
- If you want to be sure the signal is trustworthy, check whether other indicators, such moving averages, RSI, or MACD, back it up.
Engulfing Pattern Strategies
1. Trading Reversals
When looking for reversals, the engulfing pattern is often employed. One case in point is:
· Bullish Reversal: When a bullish engulfing pattern emerges at the bottom of a downtrend, it may be a good idea to wait a while before taking any more action, even after you've confirmed the reversal using other indicators.
- Bearish Reversal: Consider shorting the asset if a bearish engulfing pattern appears at the peak of a rally, signaling a possible negative reversal.
2. Combining with Support and Resistance
When engulfing patterns form close to important support or resistance levels, they may be quite effective.
· The likelihood of a price increase is increased when a bullish engulfing pattern is seen close to a support zone.
· A possible downward reversal is indicated by a bearish engulfing pattern close to a resistance zone.
3. Using Fibonacci Retracement
Integrate Fibonacci retracement levels with the engulfing pattern. One case in point is:
· A powerful purchasing opportunity may be signaled by the formation of a bullish engulfing pattern around a 61.8% retracement level.
· During a downward retracement, a bearish engulfing pattern around the same level indicates a potential selling opportunity.
Common Mistakes to Avoid
- Ignoring the Trend: When used as a signal to turn around, engulfing patterns work best. Do not trade them while the market is moving sideways or wildly.
- Overlooking Volume: False signals might occur due to the absence of volume confirmation.
- Skipping Confirmation: Before getting into a trade, make sure you have extra confirmation from indications or the market.
4. Focusing only on the Body: Candle bodies are important, but don't discount the wicks just because they don't represent levels.
Technical analysts rely on the engulfing candlestick pattern, which shows market mood and possible reversals. It is not, however, foolproof, like any instrument. You may improve your trading methods by using this pattern in conjunction with other technical indicators, comprehending its context, and diligently managing your risks.
The engulfing pattern is a powerful trading tool that, with experience, may become second nature. Best of luck with your trades!


